

Predictive Wi-Fi Survey

  • New network
  • From your floor plans

A prediction of the number of access points your site needs, and suggested locations for them, to provide the Wi-Fi reception you require.

Predictive surveys, explained on Wikipedia (opens in a new tab)

What a heat map shows

TamoGraph · signal level

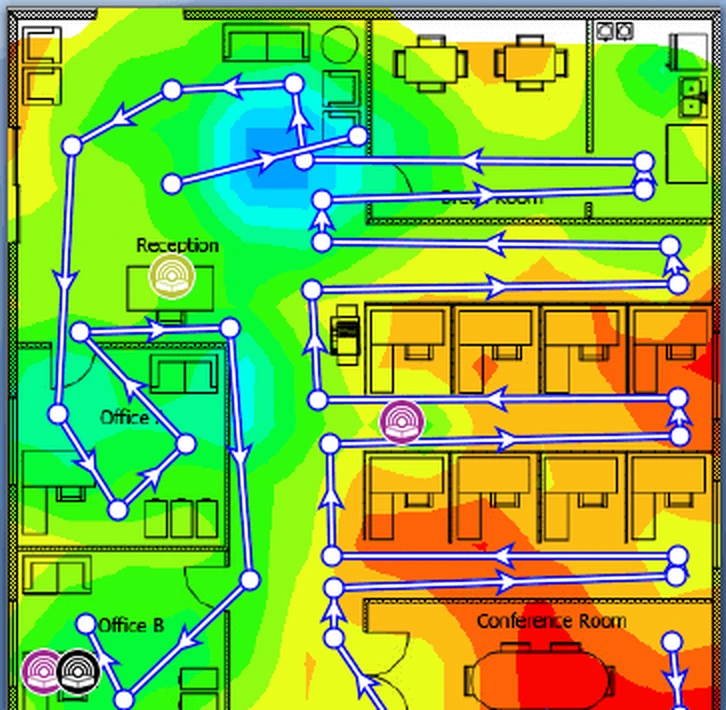
Crop of a signal-level heat map over one office floor plan: blue and green where the signal is strong, red around the conference room where it is weakest, with access point icons and a route of measurement points.
Signal level Weak -80 dBmStrong -20 dBm
  1. Blue and green: strong signal.
  2. Red: weak signal, here around the conference room.
  3. Access points marked on the scaled floor plan.
An example heat map from TamoGraph survey software, cropped to one floor.

What each wall does to the signal

Every medium, such as a wall or a lift shaft, is set by material and thickness and given a Wi-Fi signal loss.

Toolbar item: Cubicle Wall 5 cm (2 inches) Toolbar item: Elevator Shaft
Two of the wall types in the modelling software
Reflection The signal bounces off the surface.
Refraction The signal bends as it passes through.
Absorption The material soaks the signal up.

How the prediction is built

  1. Your scaled floor plans are required. We import them into modelling software, where the drawings are scaled and then annotated.
  2. Every medium is identified (walls, lift shafts and so on) by its material and thickness, and assigned a Wi-Fi signal loss.
  3. The software predicts the effects those mediums have on the signal: reflection, refraction and absorption.
  4. Virtual access points are placed on the floor plans.
  5. The software processes it all to produce a set of visualisations, the heat maps.

What you receive

  • Survey report A selection of the visualisations (heat maps) of your site.

  • Proposed solution A bespoke document naming the make and model of Wi-Fi access point, with any ancillary components such as antennas and PoE+ power injectors.

Need the access points as well? DW WiFi supplies and installs Wi-Fi too.

See the Cambium access points

Before we start

  • Scaled floor plans of the site
Enquire about a predictive survey

Opens an email to sales@dw-wifi.com, ready to send.

Or call 01952 432092

Wi-Fi Site Survey

  • New network
  • Live, on site

A ‘live’ survey on your site, using a mobile, battery-powered Wi-Fi access point. Heat-mapping software is used with your scaled floor plans, and Wi-Fi measurements are taken with a laptop at regular intervals throughout your site.

Close view of the survey kit on a mast at the top of an orange scissor lift, raised between tall pallet racking in a warehouse aisle.
On the day: the survey kit raised on a scissor lift, between the racking.
  1. Place the access point

    The mobile access point goes in an optimum location, at the Wi-Fi engineer’s discretion.

  2. Survey the area in range

    Measurements are taken with a laptop at regular intervals across the area the access point reaches.

  3. Move it and repeat

    The access point moves to the next location and the process repeats, until the entire site is surveyed.

  4. Combine the results

    The survey software combines the results for each access point location into the finished heat maps.

Illustration of the method on a sample floor plan.
On the day

  • Heat-mapping software, with your scaled floor plans
  • Wi-Fi measurements with a laptop at regular intervals
  • Spectrum analysis of the Wi-Fi bands, to monitor for any sources of interference

What you receive

  • Bespoke report Comprehensive documentation detailing the proposed solution, including photographs of the proposed access point locations.

  • Survey report A separate report of visualisations showing Wi-Fi signal levels, coverage and more, commonly known as ‘heat maps’.

Before we start

  • Scaled floor plans of the site
Enquire now

Opens an email to sales@dw-wifi.com, ready to send.

Or call 01952 432092

Wi-Fi Verification Survey

  • Existing network
  • Live, on site

A ‘live’ on-site survey of an existing Wi-Fi network. It differs from our site survey in that it surveys the network you already have, so all your Wi-Fi access points need to be operational before the survey starts.

Three bands, and the channels inside them

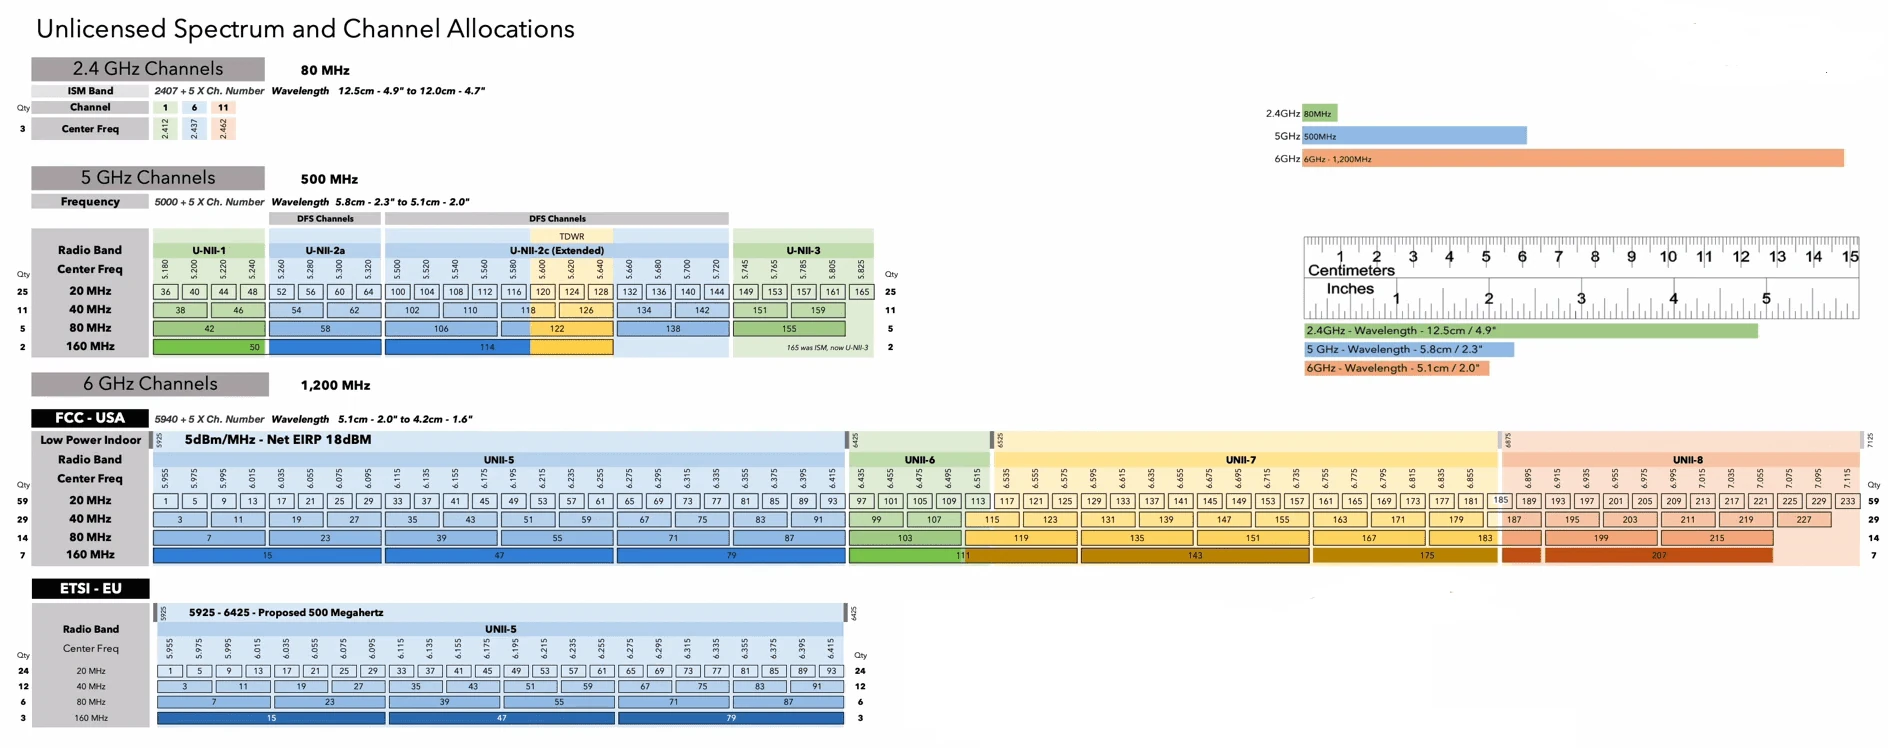
Channel allocations chart

Spectrum analysis during the visit monitors the Wi-Fi bands for any sources of interference. Each crop shows how many channels a band holds, and how they join up when bonded wider.

  1. 2.4 GHz80 MHz wide

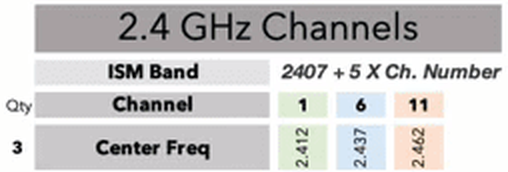
    Crop of the channel chart: the 2.4 GHz band's three non-overlapping channels, 1, 6 and 11, centred on 2.412, 2.437 and 2.462 GHz.

    Room for only three channels that do not overlap: 1, 6 and 11.

  2. 5 GHz500 MHz wide

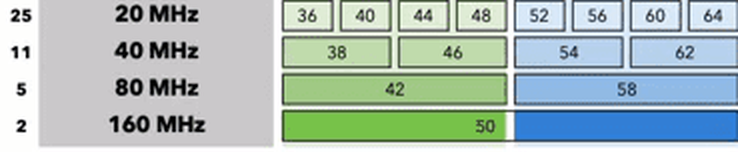
    Crop of the channel chart, start of the 5 GHz band: channels 36 to 64 at 20 MHz, bonded into 38, 46, 54 and 62 at 40 MHz, 42 and 58 at 80 MHz, and 50 at 160 MHz. The left column counts 25, 11, 5 and 2 channels at each width.

    25 channels at 20 MHz. Bond them into wider channels and that drops to 11, 5 or 2.

  3. 6 GHz1200 MHz wide

    Crop of the channel chart, start of the 6 GHz band in Europe: channels 1 to 29 at 20 MHz, bonded into 3, 11, 19 and 27 at 40 MHz, 7 and 23 at 80 MHz, and 15 at 160 MHz. The left column counts 24, 12, 6 and 3 channels at each width.

    The crop is the European part, 5925 to 6425 MHz: 24 channels at 20 MHz, or 12, 6 and 3 as they are bonded wider.

Show the full channel chart

Swipe sideways to see the whole chart.

Unlicensed spectrum and channel allocations. Open full size (image, opens in a new tab)

How it works

  1. Your scaled floor plans go into the heat-mapping software.
  2. Wi-Fi measurements are taken with a laptop at regular intervals throughout your site, from the access points you already have.
  3. Spectrum analysis of the Wi-Fi bands is completed during the visit, to monitor for any sources of interference.

What you receive

  • Bespoke report Comprehensive documentation of the network, including photographs of the access point locations.

  • Survey report A separate report of visualisations showing Wi-Fi signal levels, coverage and more, commonly known as ‘heat maps’.

Before we start

  • Every Wi-Fi access point operational before the survey starts
  • Scaled floor plans of the site
Verify your Wi-Fi network

Opens an email to sales@dw-wifi.com, ready to send.

Or call 01952 432092

Wi-Fi Health Check

  • Existing network
  • A very popular service

This service includes all the steps of a Wi-Fi Verification Survey, plus a full assessment of the configuration of your Wi-Fi access points. It is a very popular service, because it is tailored to troubleshoot the common issues when Wi-Fi is deployed.

The interference you cannot see

Common issues include co-channel interference and adjacent channel interference. Spectrum analysis of the Wi-Fi bands is also conducted, to find any sources of interference that may be contributing to poor performance of the network.

If applicable, the configuration of your Wi-Fi client devices can be assessed too, with a view to optimising both ends: the access points and the end devices.

The button opens an email to sales@dw-wifi.com with the details we need, ready for you to send.

Spectrum analysis

  1. Only three channels in 2.4 GHz avoid overlapping each other. Here the networks sit on 1, 6 and 11.
  2. A neighbouring network on channel 3 overlaps both 1 and 6. That is adjacent channel interference.
  3. A microwave oven leaking into the band in bursts: interference that is not Wi-Fi at all.
  4. Bluetooth devices hopping across the band in short blips.

An illustration of what spectrum analysis shows. Your report holds the real results from your own site.

How it works

  1. Everything in a verification survey: live measurements with your scaled floor plans, with every access point operational.
  2. Access point configuration: a full assessment of how your Wi-Fi access points are set up.
  3. Client devices, if applicable: their configuration is assessed too, to optimise both ends.
  4. Spectrum analysis: to find any sources of interference behind poor performance.

What you receive

  • Wi-Fi Health Check report A comprehensive report: a summary of the various tests carried out, any issues identified, and our recommendations.

  • Verification survey report Provided alongside it, containing the visualisations (heat maps) and the results of the spectrum analysis.

A real capture: the 2.4 GHz band

Chanalyzer 4 · Wi-Spy DBx3

Spectrum analyser capture of the 2.4 GHz band in Chanalyzer 4: humps of Wi-Fi activity around channels 1, 6 and 11 above a dense blue noise floor, with the waterfall strip beneath.
  1. Humps of Wi-Fi activity around channels 1, 6 and 11.
  2. The waterfall strip shows the same band over time, like the live view above.
Spectrum analysis of the 2.4 GHz band, as it appears in the analyser software. Cropped to the plot.

Which service do you need?

Answer two questions and we will point you to the right one, or compare all four side by side.

Is there a Wi-Fi network on the site already?
What do you need?

Answer the first question to see the choices.

Your recommended service will appear here, with what to send us and a ready-written email.

The four services side by side

Predictive Wi-Fi Survey Wi-Fi Site Survey Wi-Fi Verification Survey Wi-Fi Health Check
The network New, being planned New, being planned Existing Existing
How it is done Modelled in software from your drawings, with virtual access points Live on site, with a mobile, battery-powered access point Live on site, measuring your installed access points Live on site, measuring your installed access points
Your scaled floor plans Required Used Used Used
Heat maps Predicted Measured Measured Measured
Spectrum analysis of the Wi-Fi bands Not included During the visit During the visit Results in your report
Access point configuration Not included Not included Not included Full assessment
Client device configuration Not included Not included Not included Where applicable
You receive Survey report of heat maps, plus a proposed solution: access point make and model, antennas, PoE+ power injectors Bespoke report with photographs of the proposed access point locations, plus a heat-map report Bespoke report with photographs of the access point locations, plus a heat-map report Health Check report (tests, issues, recommendations), plus the verification survey report and spectrum results
Before we start Scaled floor plans Scaled floor plans Scaled floor plans, every access point operational Scaled floor plans, every access point operational

Swipe the table sideways to see all four.

Talk to Dave about your site

DW WiFi knows how much a business depends on a reliable Wi-Fi network, so we offer a range of services to make sure yours gives optimal performance and coverage. Send your scaled floor plans with a line about the site, or call to talk it through.