How a Wi-Fi survey improves day-to-day operations
What a Wi-Fi survey measures, a worked example from a warehouse aisle, what network data adds, and how to pick the right survey and know when to repeat it.


In this article
A Wi-Fi survey replaces guesswork with measurements. It maps where the signal is strong and clean enough for your devices, finds where it is not and why, and ends in specific changes: where each access point goes, which antenna it uses, which channel it sits on. In day-to-day terms, that means handhelds that stay connected, fewer jobs written on paper and keyed in later, and money spent only where the readings show a need.
When a business, start-up or large corporation, sets out to streamline its operations and get more done, it looks at people, processes and software, and rarely at the Wi-Fi underneath them. Yet the Wi-Fi carries the communication, the data transfer (every scan, order and stock movement) and the workflow management (the pick list on a scanner, the job sheet on a tablet), and when the signal fails all three stop together. That is how a survey improves performance and, through it, profitability: picks that do not stall, counts not keyed in twice, no access points bought for areas that already worked.
Wi-Fi problems on your premises: what next?
Good Wi-Fi in every corner is not always straightforward, because three things shape coverage and signal strength:
- Physical obstacles. Racking and stock absorb and reflect the signal, so an aisle that works half-empty can fail when it is full; liquids and metal block far more than cardboard. In a food factory, chillers and cold stores are built from steel-faced insulated panels that stop most of it. A steel foundry is metal from the structure to the castings.
- Interference from other electronic devices on the same frequencies, such as microwave ovens and Bluetooth in the 2.4 GHz band.
- The layout of the premises: long aisles, mezzanines, separate buildings, the thick stone walls of a listed building.
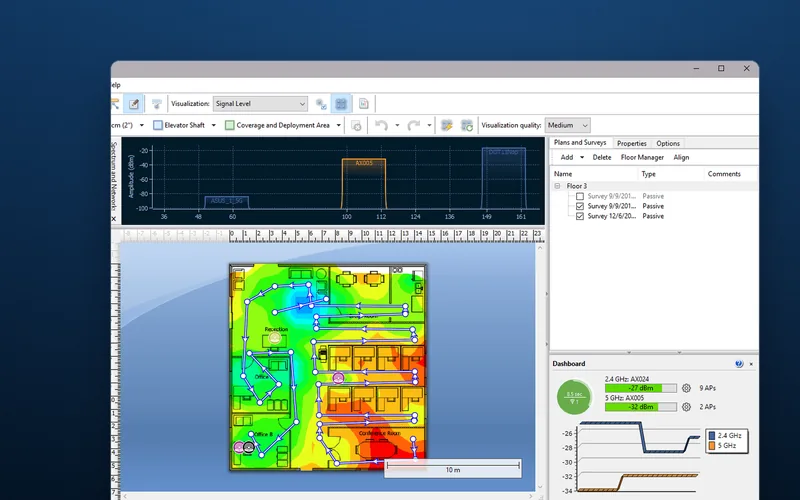
A survey assesses their effect systematically: coverage (where there is usable signal), signal strength (how much) and performance (whether the network carries your traffic). We map signal, coverage, throughput and channel overlap over your scaled floor plan as heat maps, use spectrum analysis to find interference, and judge every reading against targets set by your devices, not by the bars on a phone:
| Measure | Common target | Why it matters |
|---|---|---|
| Signal strength | -67 dBm or stronger | The usual target for handhelds and voice. Design for the weakest device: a handheld transmits at lower power than an access point. |
| Signal-to-noise ratio (SNR) | 25 dB or more | The gap between the signal and the background noise. A strong signal in a noisy hall still performs badly. |
| Channel utilisation | below about 50% at the busiest time | Above it, devices wait for their turn and the network feels slow however strong the signal. |
| 2.4 GHz channels | 1, 6 and 11, at 20 MHz | Of the 13 UK channels, the standard set of three that do not overlap. |
Measured against those numbers, problems show up that would otherwise go unnoticed until devices start dropping off. Our Wi-Fi troubleshooting guide covers each one.
More reliable, better-performing Wi-Fi
A survey is a simple, proactive way to find weak spots and fix them before they cause downtime. It gives a clear picture of performance area by area, pinpoints weak coverage and unreliable signal, and shows how the signal travels and what interferes with it. That turns “the Wi-Fi is bad in goods-in” into a specific fix:
- Move access points. One in the roof above high-bay racking pushes its signal down through the stock; moved to see down the aisles, it reaches the scanners directly. An IP-rated enclosure lets it go where the best position is wet, dusty or outdoors.
- Adjust antennas. A directional patch antenna aimed down an aisle puts the signal where the work is.
- Bring in newer technology where the existing equipment cannot deliver the signal or capacity needed, such as Wi-Fi 6 or 6E access points for a classroom where thirty pupils open tablets at once.
A worked example: the far end of the aisle
The figures are illustrative; the pattern is common. Scanners drop out at the top beam at the far end of an aisle, served by an access point in the roof mid-building. Readings at that spot, at working height, with the racking at its normal stock level:
| Reading | Before | After | Target |
|---|---|---|---|
| Signal strength | -75 dBm | -63 dBm | -67 dBm or stronger |
| Noise floor | -93 dBm | -93 dBm | As low as possible |
| SNR | 18 dB | 30 dB | 25 dB or more |
The noise floor is quiet and the channel only about 20% busy, so this is neither interference nor congestion: the SNR is low because the signal is weak. At 8 dB short of target, the scanner receives about a sixth of the power the target calls for. More bandwidth would change nothing. The fix is placement: an access point at the aisle end with a patch antenna aimed down it, confirmed by a verification survey.
Change one number and the fix changes. A signal of -64 dBm over a noise floor of -82 dBm gives the same 18 dB SNR, but that is interference: moving the access point would achieve little, and the next step is spectrum analysis to find the source. That is why the readings come before the spending.
The result is reliable Wi-Fi across the whole organisation, from a busy office to a manufacturing floor: in a warehouse, scanners that stay connected at the top of the racking and the far end of the aisle.
Optimising space and resources
The first resource a survey allocates is the equipment budget: access points go only where the readings show a gap, and we have found time after time that a good survey before you buy saves money.
How the space is used comes from the network, not the survey. A cloud-managed network logs how many devices join each access point, hour by hour; those usage patterns and that user behaviour show how the Wi-Fi is used through the day and, in an office, roughly how people move around the workspace. The picture is coarse (an access point covers an area, not a desk, and one person may carry two devices), but where some areas are consistently overcrowded and others underused, it is evidence for an efficiency decision: re-planning desks, meeting rooms and common areas around how staff actually work, for better workflow, collaboration and productivity. The survey’s part is finding the congestion and poor connectivity that stop staff reaching the systems they need, so the coverage can be put right.
A better experience for customers and guests
In a hotel or restaurant, reliable Wi-Fi is part of the service. Guests expect every step to be smooth and personal, and the places that stand out deliver that to a five-star standard, connection included. They use the Wi-Fi to work, for entertainment and to keep in touch during their stay, so the busy hour is usually the evening in the bedrooms, not the daytime in the lobby, and an access point in the corridor has to reach each room through the door and often the bathroom. A professional survey assesses coverage and connectivity across rooms and public areas so the network meets those expectations; weak spots are fixed by adding access points or fine-tuning network settings. In a listed building, thick stone walls stop signal that a modern partition would let through, and new fixings or cable routes can need listed building consent.
Decisions based on data, not guesswork
Monitoring the live network adds what a one-day survey cannot: device connectivity (which devices join, drop off and roam, and where) and data usage patterns over weeks. Read alongside the survey, those metrics show where the Wi-Fi can improve, typically an area where weak signal or high congestion holds up the flow of data, and the readings point to a targeted response rather than a blanket spend:
- Signal weak where the work happens: expand coverage, by moving access points or adding them.
- Signal fine, SNR low: find the interference with spectrum analysis before buying anything.
- Signal and SNR fine, channel busy at the peak: fine-tune the configuration, with narrower channels, fewer network names (SSIDs) and the oldest data rates switched off once nothing needs them.
- Still busy after tuning, or more devices than the equipment can serve: upgrade the infrastructure.
The same patterns can point beyond the Wi-Fi. Handhelds crowding onto one access point at goods-in every morning can mark a workflow bottleneck. If scanners drop out in the cold store, the counts go on paper and are keyed in later; extend coverage there and that manual step can be automated on the scanner, streamlining an internal process. Treat the data as a reason to go and look, not a verdict.
Which survey, and when to survey again
A survey records the building, the stock and the devices as they were on the day. It has no fixed expiry date; it stays accurate until one of them changes. Choose by where you are now:
| Where you are | Survey | What it gives you |
|---|---|---|
| Planning a new building, extension or network | Predictive survey | Your floor plans modelled in software: how many access points, where, and which models. |
| A building in use, with a new or replacement network to design | Site survey | Live measurements with a battery-powered access point, and the proposed positions photographed. |
| A network in place, or something has changed: re-racking, a mezzanine, a new product mix, new handhelds, a neighbour’s new network | Verification survey | The existing network measured as it performs now. |
| Devices already dropping out or running slowly | Health check | A verification survey plus a review of the access point configuration, and the client devices where relevant. |
Survey with the racking at its normal stock level and with the devices you actually use: a warehouse surveyed in a quiet month can look better than it performs at peak. After any new installation, a verification survey checks the network against its design before you rely on it.
Get your business Wi-Fi problems solved
Wi-Fi problems are quicker to solve with expert guidance. DW WiFi has more than 20 years of experience designing and deploying Wi-Fi in warehouses, factories, schools, hotels and office blocks, and every survey is tailored to the site and the problem. We also work alongside software providers, deploying Wi-Fi into their customers’ manufacturing and warehousing sites across Europe. Among our regular clients is CabinetPro: from food factories to steel foundries, our surveys find the best positions for their stainless steel touchscreen PCs and kiosks.
Get in touch with DW WiFi and tell us what is going wrong and where. If you have a scaled floor plan, send it with your enquiry: every survey starts from one. To see how an on-site survey works, read about our Wi-Fi site surveys.