Business Wi-Fi surveys: four stages to reliable coverage and speed
What happens at each of the four stages of a business Wi-Fi survey, the signal targets it should prove, and which survey to book for a new or failing network.

In this article
A business Wi-Fi survey measures the signal across your whole site against what your devices need, finds out why it falls short, then proves the fix worked. It runs in four stages: planning, data collection, analysis and implementation, and validation. Before a new network goes in, it pre-empts coverage problems instead of discovering them at go-live. On a running network, it examines the existing setup to find the weak points and gather the data to optimise coverage.
When the Wi-Fi drops without warning, work stops and the complaints arrive, from staff, users and clients alike. When it keeps dropping or lagging, frustration builds and work slows to the pace of the weakest connection, such as a scanner that loses the network halfway down an aisle. A survey pinpoints the root cause, so the fix goes where the problem is, not where the loudest complaint came from.
What a survey measures, and what counts as good
Think of a Wi-Fi survey as a full health assessment for your wireless network. An engineer uses specialised tools and survey software to measure signal strength, coverage, sources of interference and data transfer rates across the whole site. That gives your IT team or network administrator the evidence to identify the real issues and design a fix tailored to the site, for connectivity that is consistent, fast and reliable everywhere. Each reading is judged against a target, and these are the widely used ones:
| Measure | Aim for | Short of it, expect |
|---|---|---|
| Signal strength | -67 dBm or stronger for handhelds, voice and video; about -70 dBm for office data | Drop-outs and slow scans at the edges |
| Signal-to-noise ratio (SNR) | 25 dB or more | Slow speeds and resends, even where the signal looks strong |
| A second access point | Heard clearly wherever devices move | Devices clinging to a fading access point instead of roaming |
| Channel utilisation | Below about 50% | A slow network however strong the signal |
Signal is measured in dBm, a negative number that gets closer to zero as the signal strengthens. Every 3 dB halves or doubles the power, so -73 dBm carries a quarter of the power of -67 dBm. SNR is how far the signal stands above the background noise (see what defines Wi-Fi quality). One caution when reading a survey report: a handheld scanner’s small antenna usually hears less than a survey laptop, so a good survey measures with the real device or builds in a margin for it.
The four stages of a business Wi-Fi survey
Planning
Planning starts with a consultation about your environment: the layout, and any architectural features that might affect Wi-Fi signals, such as the lift shafts of an office block. The building shapes the design more than any datasheet. Where DW WiFi works most:
- Warehouses with high-bay racking
- Steel racking and dense stock block signal like a thick wall, and stock with a high water content, such as drinks, absorbs it. A full aisle behaves very differently from an empty one, so survey with the racking loaded as normal, and read the top levels and the far end of every aisle.
- Food factories and steel foundries
- Stainless steel reflects signal, washdown areas need access points in sealed, IP-rated enclosures, and heavy machinery can raise the background noise. DW WiFi surveys sites like these for CabinetPro, calculating the best positions for its stainless steel touchscreen PCs and kiosks.
- Schools
- Block walls between classrooms and a whole class connecting at once, so capacity in each room matters as much as coverage.
- Listed buildings
- Thick solid walls, and fixings or cable runs that may need listed building consent. Every access point position has to be right first time.
The second set of questions is how your site uses its Wi-Fi, because that sets the targets:
- video calls that cannot afford to freeze, which need a steady signal in every meeting room
- colleagues sharing files with each other, which needs throughput
- a busy office with many devices connected at once, which needs capacity: more access points at lower power, not fewer, louder ones
- handheld scanners, tablets and touchscreen PCs on a warehouse or factory floor, which need coverage everywhere they go and a clean handover from one access point to the next
That tailors the survey to a reliable, efficient Wi-Fi network built around how your business works. Have your scaled floor plans ready, because DW WiFi’s survey software works from them, plus the makes and models of the devices that must work: some older handhelds only support 2.4 GHz, which changes the design.
Data collection
Data collection is the site visit. The engineer loads your scaled floor plans into heat-mapping software and walks the site, taking measurements with a laptop at regular intervals. For a new network, a battery-powered access point goes where the engineer judges best, at the height a real one would be mounted, which in a high-bay warehouse can mean a scissor lift between the racking. The area in its range is surveyed, then the access point moves and the process repeats until the whole site is done. For an existing network, the walk measures the installed access points. Either way, survey on a normal working day, with stock on the racking and machines running.
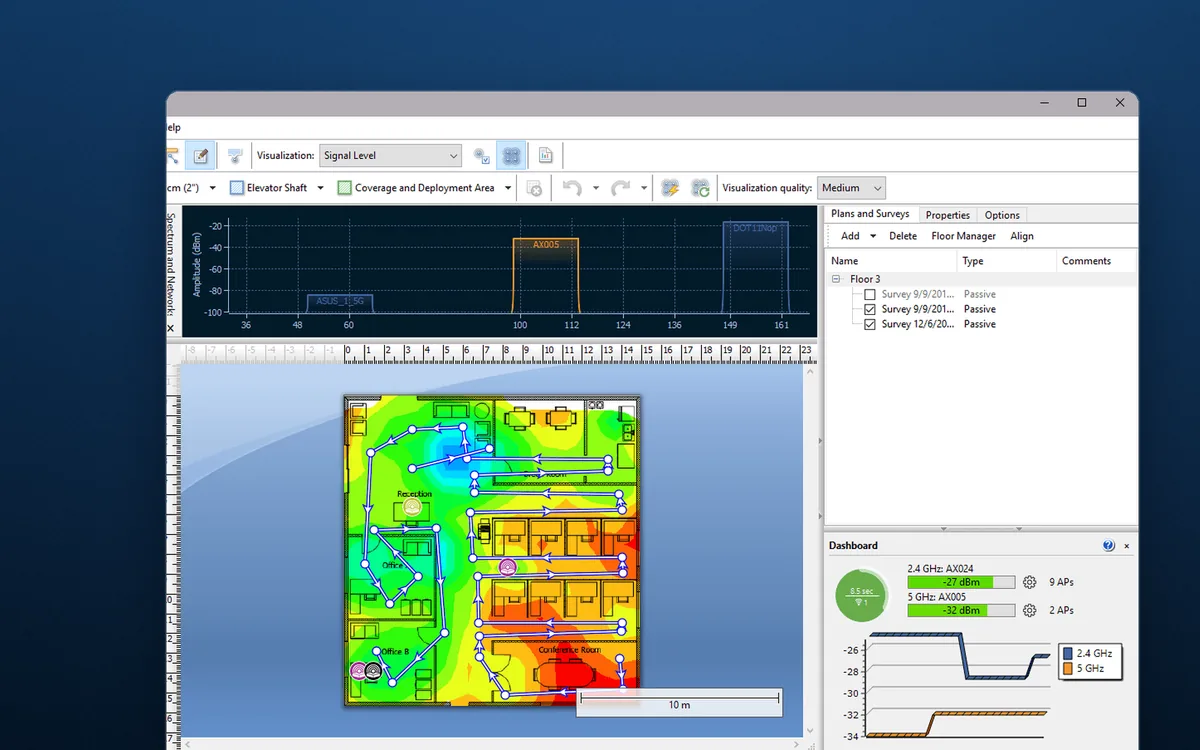
The readings cover signal strength, the quality of the Wi-Fi signal at each point; coverage patterns, how well the signal spreads across the space, including where a second access point is heard for roaming; and sources of interference, such as neighbouring Wi-Fi networks or physical obstructions. DW WiFi also runs spectrum analysis of the Wi-Fi bands, which catches non-Wi-Fi sources such as microwave ovens and Bluetooth devices. Together they show where the signal is weak or inconsistent: the dead zones where devices struggle or drop off, each of which may need its own targeted improvement. The survey software captures the data in real time and turns it into visual maps of the Wi-Fi environment.
Analysis and implementation
Back from site, the engineer works through the heat maps (floor plans coloured by signal strength) and signal-strength graphs for the patterns and trends behind the problems: a main aisle that falls away sharply at the back wall, the same channel heard from four access points across one open hall, a good signal with poor SNR beside a line of machinery. From that comes a customised plan, which may involve:
- Refining access point placement. Moving, adding or removing access points so coverage follows where people and devices work. In racked aisles, an access point in the aisle, or a directional patch antenna aimed down it, usually beats one in the roof pushing its signal through the stock. DW WiFi makes its own pan and tilt bracket for aiming Cisco’s dual-band patch antenna.
- Adjusting channel and power settings. Access points on the same channel share its airtime: a device waits whenever it hears another Wi-Fi transmission on its channel above about -82 dBm. 2.4 GHz has only three channels that do not overlap, 1, 6 and 11. 5 GHz has around twenty 20 MHz channels in the UK, though on many of them an access point must move off if it detects radar (see understanding Wi-Fi channels). And an access point louder than the handhelds can answer leaves a one-sided link: the device hears the network, but the network cannot hear the device.
- Making better use of the frequency bands. 2.4 GHz reaches further but is crowded; 5 GHz carries more over a shorter range; Wi-Fi 6E and Wi-Fi 7 add 6 GHz. The fix may be band steering capable devices onto 5 GHz, or choosing which bands to offer in each area, checked against the device list.
On a DW WiFi site survey, the plan arrives as a bespoke report with photographs of the proposed access point locations, plus a separate survey report of the heat maps. The recommended changes are then made.
Validation
Once the recommended solution is in place, a full post-deployment validation survey checks that it worked, and it measures more than signal strength. A survey that only listens cannot prove speed, so validation connects to the network and moves data, testing data transfer rates and network stability. Stability matters most for anything that moves: walk a real picking route with the handheld that will use it, and watch for drops at each handover.
The engineer also hunts for anything left over, such as coverage still short of target or interference the changes did not fully resolve. At DW WiFi this is the Wi-Fi Verification Survey: a live survey of the network as built, with spectrum analysis, once every access point is running. For the software providers DW WiFi works alongside, deploying devices into their customers’ sites, it is the documented proof that the Wi-Fi is ready before rollout.
Which survey to book
- No network yet, and you need a budget: a Predictive Wi-Fi Survey models from your floor plans how many access points you need and where. Among racking, stock or steel, a site survey then confirms what the model assumed.
- A new network, or an extension in a difficult building: a Wi-Fi Site Survey, measured with a real access point before anything is fixed to a wall.
- Just installed, or a device rollout about to go live: a Wi-Fi Verification Survey.
- Already in and still dropping out: the Wi-Fi Health Check, a verification survey plus a full review of the access point configuration (and the client devices, where relevant), built to troubleshoot common faults such as co-channel and adjacent channel interference.
The aim is the same in a busy office, a home office or on a warehouse floor: every corner covered, at the speed the work needs. Get in touch with DW WiFi with your floor plans, the devices that must work and where it goes wrong, and we will tell you which survey fits.