Four common Wi-Fi problems and how a professional survey solves them
How to tell whether slow or dropping Wi-Fi is a coverage, congestion, interference or device problem, the numbers to measure it against, and which survey fixes it.

In this article
Slow speeds, dropped connections and dead zones, whether in an office or halfway down a warehouse aisle, nearly always come down to a coverage gap, congestion or interference, unless one make of device is at fault. Where, when and on which devices the trouble happens tells you which. A fourth problem, weak security, rarely shows a symptom at all, so it is found by checking, not by complaints. A professional Wi-Fi survey, a thorough on-site assessment by a trained engineer with specialist tools, confirms the cause and designs the fix.
Which problem do you have?
First check it is the Wi-Fi at all: if a cabled PC nearby is slow at the same moment, look at the internet line or the server, not the radio. Then ask where it happens, when, and on which devices.
| What you notice | Likely cause | Usual fix |
|---|---|---|
| Drops in the same places every time, on every device | Coverage gap | Access points placed where the devices are |
| Fine when quiet, slow at busy times | Congestion | A channel plan and better access point settings |
| Drops and slowdowns that come and go, busy or not | Interference | Cleaner channels, equipment and antennas moved |
| One make or model struggles where others cope | The device | Driver or firmware update, device settings |
| Nothing you would notice | Security weakness | Current encryption, stronger access controls |
To test the device, stand two different models side by side where the trouble happens. If one copes and the other drops, look at the device: drivers or firmware, power-saving settings, or an older handheld that cannot use 5 GHz at all. Roaming is the device’s decision too. It moves only when the signal falls past its own threshold, so a handheld that waits too long clings to a distant access point while a nearer one sits overhead. Reconnecting clears it only until it next moves; the lasting fix is its roaming settings, the 802.11k, v and r roaming aids where it supports them, and a design that gives it somewhere better to go.
What good Wi-Fi looks like in numbers
Signal bars show only what the device hears, not the noise, how busy the channel is, or whether the access point hears the device back. These widely used design targets suit handheld scanners, voice and other real-time use (office browsing tolerates a little less); where a handheld maker’s deployment guide sets stricter minimums, use those.
| Measure | Target | Why |
|---|---|---|
| Signal strength | -67 dBm or stronger where devices are used | Below it, devices fall back to slow data rates, then disconnect |
| Signal-to-noise ratio (SNR) | 25 dB or more (20 dB for general data) | A strong signal over loud noise still loses data |
| Channel utilisation | Under about 50 per cent at the busiest time | Above it, devices queue for airtime and everything slows |
| Retries | Under about 10 per cent of transmissions | Each retry spends the airtime twice |
| Overlap between access points | Around 15 to 20 per cent at the target signal | A moving device always has a second access point to roam to |
Read together, they name the cause: weak signal points to coverage, high utilisation to congestion, and poor SNR or high retries despite a good signal to interference.
1. Coverage gaps and dead zones
A dead zone is anywhere the signal weakens until devices struggle or drop off, usually because of thick walls, interference from other devices or badly placed access points. Higher bands fade faster: 5 GHz and 6 GHz lose more over distance and through walls than 2.4 GHz, so a site covered at 2.4 GHz can still have gaps in the band you want devices on. On industrial sites the “walls” take other forms:
- Warehouses. Steel racking and dense stock block signal like a thick wall, so a scanner works at one end of an aisle and drops out halfway along. Full racking blocks more than empty, and water-heavy stock such as drinks absorbs Wi-Fi strongly, so a network surveyed in a quiet month can struggle at peak.
- Food factories. A cold store built from metal-faced insulated panels keeps Wi-Fi out, so it usually needs an access point inside, in an enclosure rated for the cold and the washdown.
- Steel foundries. Metal reflects and blocks signal, and the heat and dust call for protective enclosures.
- Listed buildings. Thick stone stops signal room by room, and fixings or cable runs may need listed building consent.
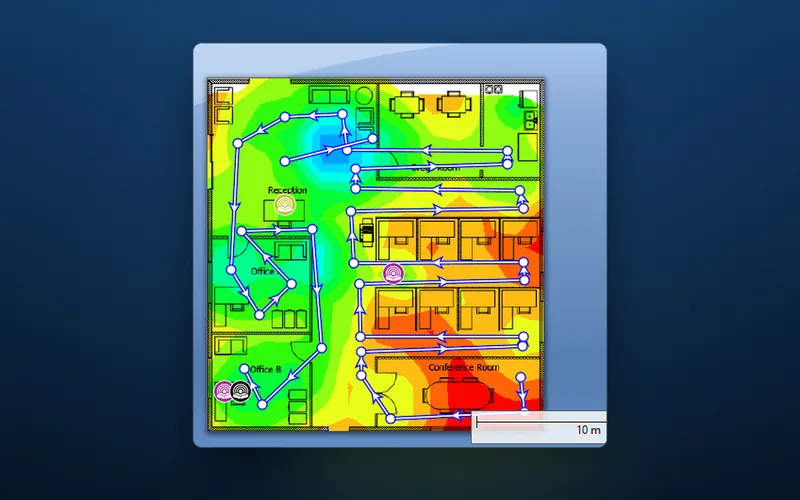
A survey goes well beyond checking signal strength at a few spots. It maps how the signal spreads through the whole space, where it fades or disappears and why, at the height devices are used: waist height in an aisle is not the top beam from a reach truck. It also allows for the handheld, whose small antenna often hears less than the survey adapter does.
A heat map shows only what the access point sends, and a connection runs both ways. Handhelds usually transmit at lower power than access points, so turning an access point up flatters the map while the far-corner scanner hears it but cannot be heard.
The engineer then designs the fix for your site: where access points go, each cabled back to the network at sensible power, so the signal reaches even the awkward corners and coverage is reliable throughout. Signal boosters (repeaters and range extenders) re-send traffic over the air, often doubling the airtime it takes, so business networks generally avoid them, keeping wireless mesh links for spots no cable can reach.
Worked example: drop-outs at the back of the racking
Illustrative figures, not a particular site. Scanners drop at the back of five aisles, all day, on every model: a coverage pattern. At waist height the survey reads -74 dBm over a -92 dBm noise floor, an SNR of 18 dB, against targets of -67 dBm and 25 dB. The only access point in range hangs over the front walkway, behind full racking; turning it up would flatter the map, not help the scanners reply. The fix: a second access point over the back cross aisle, cabled, at moderate power, on a clear channel. Re-surveyed, the same spots read -62 dBm and 30 dB, with enough overlap for scanners to roam between the two.
2. Network congestion
Congestion is one of the most common problems, especially in offices full of connected devices, and it shows up as slow speeds and unreliable connections. Devices on a channel take turns to transmit, so the more devices, and the more same-channel access points within range of each other, the less airtime each gets. Adding access points without a channel plan can make a network slower.
A survey looks at traffic patterns to find where, and when, bandwidth is stretched thinnest: a class logging on as a lesson starts, or a shift of handhelds starting together. Two culprits are easy to miss:
- Slow devices. A device on a weak signal, or an old one, sends at a low data rate and everyone else waits: data sent at 6 Mbps occupies the air 50 times longer than at 300 Mbps.
- Too many SSIDs. Every network name is announced about ten times a second on every radio, at the slowest rate allowed. Keep to three or four.
Warehouse scanners send little data, so there the shortage is airtime, not bandwidth. The fixes are mostly configuration: optimising channel assignments and fine-tuning access point and network settings, from transmit power and channel width to minimum data rates. Done well, the same access points carry more: fewer bottlenecks, more usable bandwidth, faster speeds, smoother streaming and connections that stay up, even with a device on every desk.
Worked example: a busy channel in an empty building
Illustrative figures again. Handhelds in a distribution centre stall for the first half hour of every shift. At 5 a.m., with nobody working, 2.4 GHz channel utilisation already reads above 60 per cent. It is beacons: six SSIDs, each announced ten times a second at 1 Mbps by the four access points heard on each channel. At that rate a 300-byte beacon holds the air for about 2.6 milliseconds, so those 240 a second take about 60 per cent of the airtime. The fix needs no new hardware: three SSIDs, and the old 802.11b rates (1 to 11 Mbps) switched off once the survey confirms no device needs them, so beacons go at 12 Mbps. Beacon load falls below 3 per cent, and the stall goes with it.
3. Interference
Interference from neighbouring Wi-Fi networks and other electronic equipment lowers the quality and reliability of your signal. Garbled transmissions are sent again, and as retries mount, devices drop to slower data rates, so speeds fall, connections drop and performance suffers. The engineer scans for the sources with specialised tools. The usual ones:
- neighbouring Wi-Fi networks on the same frequency bands, common on business parks
- non-Wi-Fi devices such as microwave ovens
- Bluetooth devices, including the ring scanners and headsets many pickers wear
Wi-Fi uses channels in the 2.4 GHz and 5 GHz bands, plus 6 GHz on Wi-Fi 6E and Wi-Fi 7 equipment. Plan on UK figures, not the American ones many guides quote (24 or 25 channels at 5 GHz, 59 at 6 GHz):
| Band | Usual UK channels | The catch |
|---|---|---|
| 2.4 GHz | 3 that do not overlap: 1, 6 and 11 of the 13 | Shared with microwave ovens and Bluetooth; the most crowded band |
| 5 GHz | 19 at 20 MHz (36 to 64, 100 to 140), 9 at 40 MHz, 4 at 80 MHz | Most are DFS channels: an access point that detects radar must move, briefly dropping its devices |
| 6 GHz | 24 at 20 MHz, in the lower band Ofcom opened to Wi-Fi in 2020 | Wi-Fi 6E and Wi-Fi 7 devices only, and only with WPA3 or Enhanced Open security |
The main fix is choosing channels with less congestion and overlap, which cuts interference from neighbouring networks, and moving devices that can onto 5 GHz or 6 GHz, away from microwaves and Bluetooth (band steering helps). The engineer may also move Wi-Fi equipment away from congested areas or reposition antennas to optimise signal strength, such as a directional antenna on a pan and tilt bracket aimed down an aisle. More in our guide to Wi-Fi channels.
Spectrum analysis
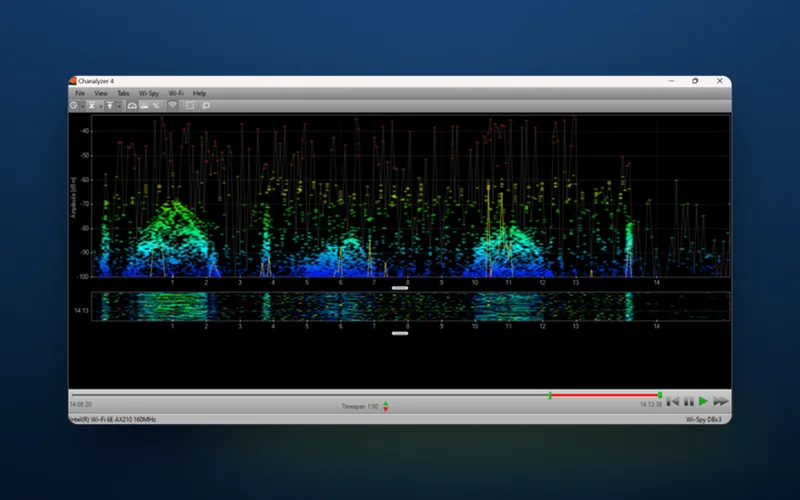
A Wi-Fi adapter only recognises Wi-Fi: to it, a microwave oven is just a higher noise floor. Spectrum analysis shows the whole RF spectrum on site, so the engineer can see the specific frequencies where interference occurs, identify the non-Wi-Fi sources and decide how to deal with them. DW WiFi runs it during every on-site survey and Health Check.
Worked example: drop-outs at break time
Illustrative figures again. In a food factory, 2.4 GHz scanners in the corridor by the staff canteen drop for minutes at a time, mostly at breaks, when the floor is quieter, not busier. Signal reads a healthy -58 dBm, but retries climb from about 5 to over 30 per cent. Spectrum analysis shows why: a broad burst around 2.45 GHz, the frequency microwave ovens use, whenever the canteen ovens run. The fix: that access point moved from channel 11 to channel 1 (centred at 2.412 GHz, the furthest of the three from the ovens), its neighbours re-planned to suit, and every scanner that can moved onto 5 GHz.
4. Security weaknesses
A survey also checks the network’s security against current industry standards, looking for weaknesses that could let in unauthorised users or expose the network to other threats.
Encryption. The engineer checks the protocol in use, such as WPA2 or WPA3: whether it is effective, up to date and configured correctly against eavesdropping and data interception. WEP and WPA with TKIP are broken and should be gone; older WPA2-only handhelds keep WPA2 in service until they are replaced.
Access controls. Only authorised users and devices should be able to join. The survey reviews controls such as MAC address filtering and guest network segregation (keeping visitors off your business network), and may recommend new controls or stronger existing ones. One shared password every past employee knows is a common weakness. More in our post on Wi-Fi security measures.
Getting a Wi-Fi survey from DW WiFi
Whichever problem you have, a DW WiFi survey gives you a detailed assessment of your network’s strengths and weaknesses, so you can make informed decisions to optimise your Wi-Fi from measurements, not guesses. Choose by where you are now:
- Installed but underperforming, or about to carry new handhelds: a Wi-Fi Health Check. A Verification Survey plus an assessment of access point and, where it applies, client device configuration, with a report of tests, issues and recommendations.
- Just installed, and you want proof: a Wi-Fi Verification Survey of the live network, with heat maps and spectrum analysis.
- New building, refit or new racking layout: a Wi-Fi Site Survey, measured with a temporary, battery-powered access point before anything is installed.
- Drawings only: a Predictive Wi-Fi Survey, modelled from your scaled floor plans.
Bring your answers on where, when and which devices, with your scaled floor plans, when you contact DW WiFi, and we can talk through which survey fits.